在开发一个go模块hermes的时候遇到了一个很诡异的问题,该系统的部分流程如下: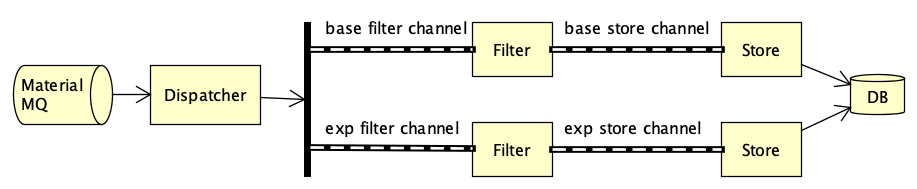
hermes订阅了一个推送物料的MQ,由于要做小流量实验,通过一个Dispatcher将物料分成了两条流,分别写到不同的filter channel,Filter模块消费该channel并进行一些参数判断过滤,再写入store channel,Store模块消费该channel并通过redis去重,如果不重复则写入MySQL,并在redis里标记该物料已经处理过了,但是进程在跑了几分钟之后MQ订阅中止了,开始以为是测试环境MQ连接有问题,调试之后才发现是channel阻塞了。在这里记录下调试过程,包括Linux下常用调试命令free、ps、top、strace、pstack等和go的调试工具pprof的使用。
1、Linux调试
系统内存占用
在确认不是MQ连接的问题之后,先是怀疑OOM了,用free看了下机器内存使用情况,从”-/+ buffers/cache”这一行可以看到能够挪用的内存还有9869M,不是OOM。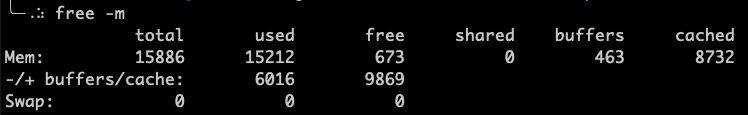
查看日志也确认没有OOM信息:
程序内存占用
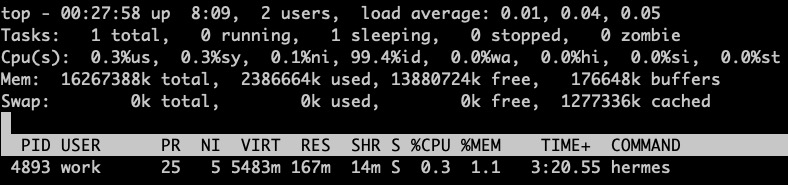
ps和top看下,占用的内存也并不高:
查看进程栈信息
2、go pprof调试
在程序中加上pprof调试代码之后,查看goroutine堆栈信息,发现有一个异常信息:1
goroutine 17 [chan send, 29 minutes, locked to thread]
堆栈信息开始于MQ订阅,阻塞于Dispatcher写入filter channel的时候,而Filter模块只是进行参数的判断过滤,没有进行网络请求或者IO操作,应该处理的很快,那可能是下游的store channel阻塞了,因为Store模块会请求Redis和MySQL,有网络请求和IO操作,处理比较慢,而Store模块是串行处理store channel里的数据的。于是将Store改为并行处理store channel,读取channel里的数据之后用goroutine进行处理。同时将上下游channel的大小都从1024改为10240,提高channel容量,有更大的缓冲空间。改完重新编译运行,发现MQ消费不会中断了!问题得以解决。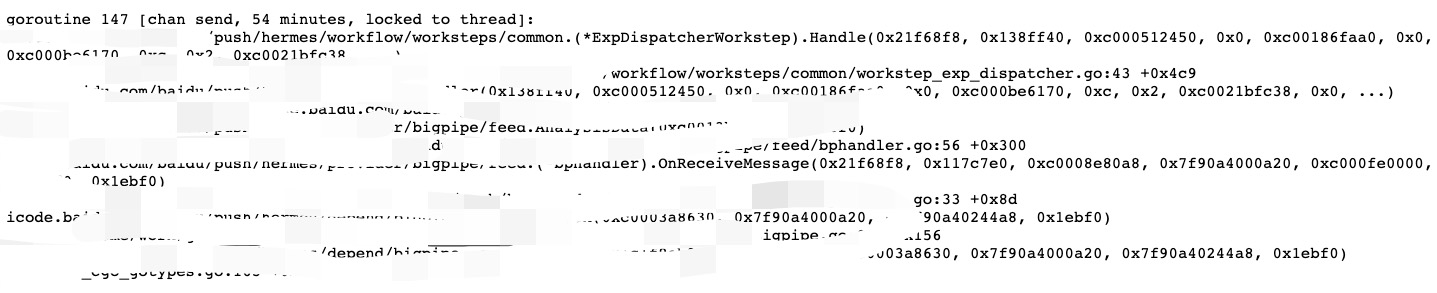
3、附:Linux几个调试命令输出内容说明
free
示例
输出结果对应字段说明
- Mem:内存的使用情况
- -/+ buffers/cache:表示物理内存已用多少,可用多少
- Swap:交换空间的使用情况
关于buffers和cached的区别
- A buffer is something that has yet to be “written” to disk.
- A cache is something that has been “read” from the disk and stored for later use.
计算
- Mem
- total = used + free
- -/+ buffers/cache
- used = Mem used - Mem buffers - Mem cached
- free = Mem free + Mem buffers + Mem cached
ps aux
示例
输出结果对应字段说明
- USER:进程的所有者
- PID:进程ID号
- %CPU:CPU占用率
- %MEM:内存占用率
- VSZ:虚拟内存使用量(单位KB)
- RSS:占用的固定内存量(单位KB)
- TTY:所在终端
- STAT:进程状态
- START:被启动的时间
- TIME:实际使用CPU的时间
- COMMAND:命令名称与参数
进程状态说明:
D Uninterruptible sleep (usually IO)
R Running or runnable (on run queue)
S Interruptible sleep (waiting for an event to complete)
T Stopped, either by a job control signal or because it is being traced.
W paging (not valid since the 2.6.xx kernel)
X dead (should never be seen)
Z Defunct (“zombie”) process, terminated but not reaped by its parent.
For BSD formats and when the stat keyword is used, additional characters may be displayed:
< high-priority (not nice to other users)
N low-priority (nice to other users)
L has pages locked into memory (for real-time and custom IO)
s is a session leader
l is multi-threaded (using CLONE_THREAD, like NPTL pthreads do)
+ is in the foreground process group